Facebook is dominating the social media landscape. But by how much?
The average Smartphone user spends in excess of 2 hours a day looking at their screens, either texting, browsing the internet, scrolling through emails and more often than not using apps.
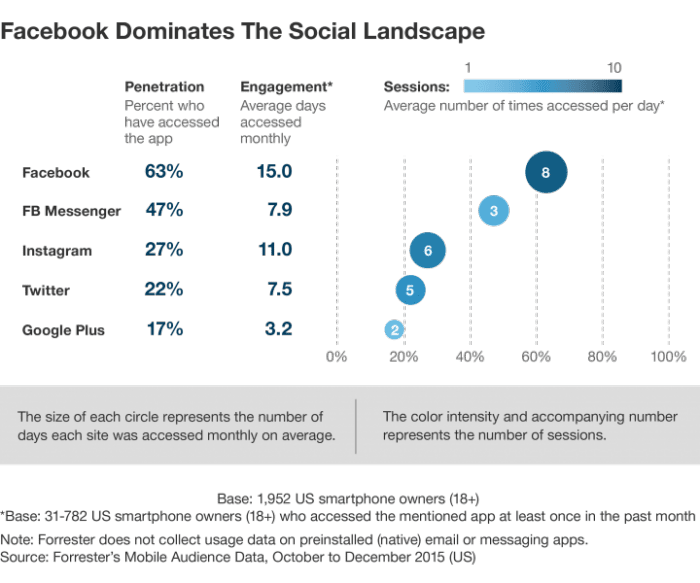
Now it's the use of apps in particular which is the focus of this article, more specifically around social networks. The below chart compares the reach of social media, as well as the average number of days per month and the sessions per day.
One of the most pertinent takeaways from the Forresters Report, is just how "addictive:" Facebook is. The chart breaks down the amount of touch points or "session" we have with the apps throughout the day. Facebook leads the way with on average 8 sessions, per day used. Followed by Instagram with 6 and Twitter with 5. This highlights the constant need for communication and content, we need everyday.
This chart, once again, highlights the dominance Facebook has over their competition, with a penetration rate of 63%, a whole 35% higher than the next closest competitor Instagram. Twitter performs favourably too, with a 22% penetration rate, however it is somewhat overshadowed by Facebook's dominance.
Facebook are again out in front in terms of Engagement, on average being accessed around one day out of every two. Instagram aren't far behind, as it is being accessed on average one day out of every three.
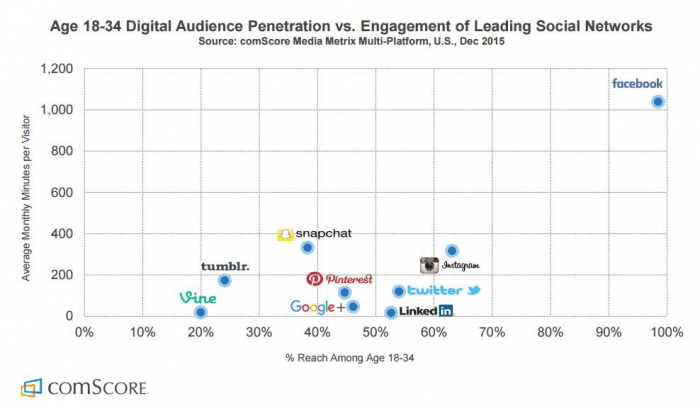
The below chart delves into the penetration vs engagement situation, with a little more detail. If you want to do some further reading on the matter, ComScore recently published their US Cross-Platform Future in Focus
- Sources: Forrester Report - The Uptake and Engagement of Social Media Apps in the US and the UK & ComScore - 2016 U.S Cross-Platform Future in Focus
- Data Set: Forrester's Mobile Audience Data* &
- Date: May 2016 & March 2016
* Forrester's mobile audience data helps you understand how your customers behave in their mobile moments — and if you play any role at all. It will give you a better understanding of your target consumers and how they use their mobiles and tablets, from the amount of time they spend on different social media outlets to their most popular time of day to visit shopping websites. We track behavior using a passive application on consumers' smartphones and tablets that allows us to subtly collect data without disrupting normal behavior. Compared with other data sources, it allows us to capture actions at a very detailed level with precision, eliminating measurement errors by analyzing usage of what consumers do, not what they say they do
If you're keen to find out more details about social media, have a look at our social media statistics post for similar information.
from Smart Insights http://ift.tt/22Amve0
via IFTTT


0 comments:
Post a Comment